In this week’s release of Surgical Spotlight we released a couple updates for how we view cases in the case viewer and for how some of the validations are displayed. Both of these things should make your life a lot simpler when looking at cases and data issues. We also are proud to announce that our very own Blake Stock is presenting to the DFW Hospital Council about improving visibility in the OR with analytics!
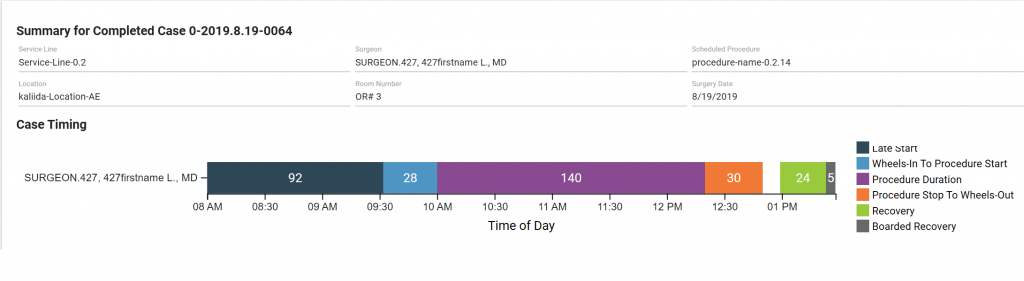
Case Timings Update
In one of our recent releases we added a chart of the case timings to our Case Viewer. We improved the chart this week by changing the scale from minutes to time-of-day. We made the change to make it easier to see all of the pertinent case times at a glance, rather than having to look at the all of the details below.
Instead of showing minutes starting at zero, we now show you the scheduled start time and the minutes for each phase. One of the beneficial side effects of this is that we now show you any gaps, for instance from when the procedure is complete to recovery while a patient is in transition. This can help improve visibility in the OR.
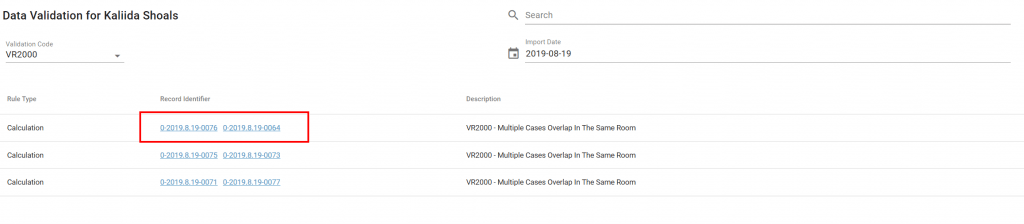
Overlapping Cases in the Same Room
Data validation can be tricky, and when a flag is raised over two cases overlapping, it can be challenging to surface the issue. When two cases are documented as overlapping in the same room, it can be tough to get to the details for each of those cases. We now have a solution for our customers that provides two separate case links in the data validation viewer, making it easy to find the resolution.
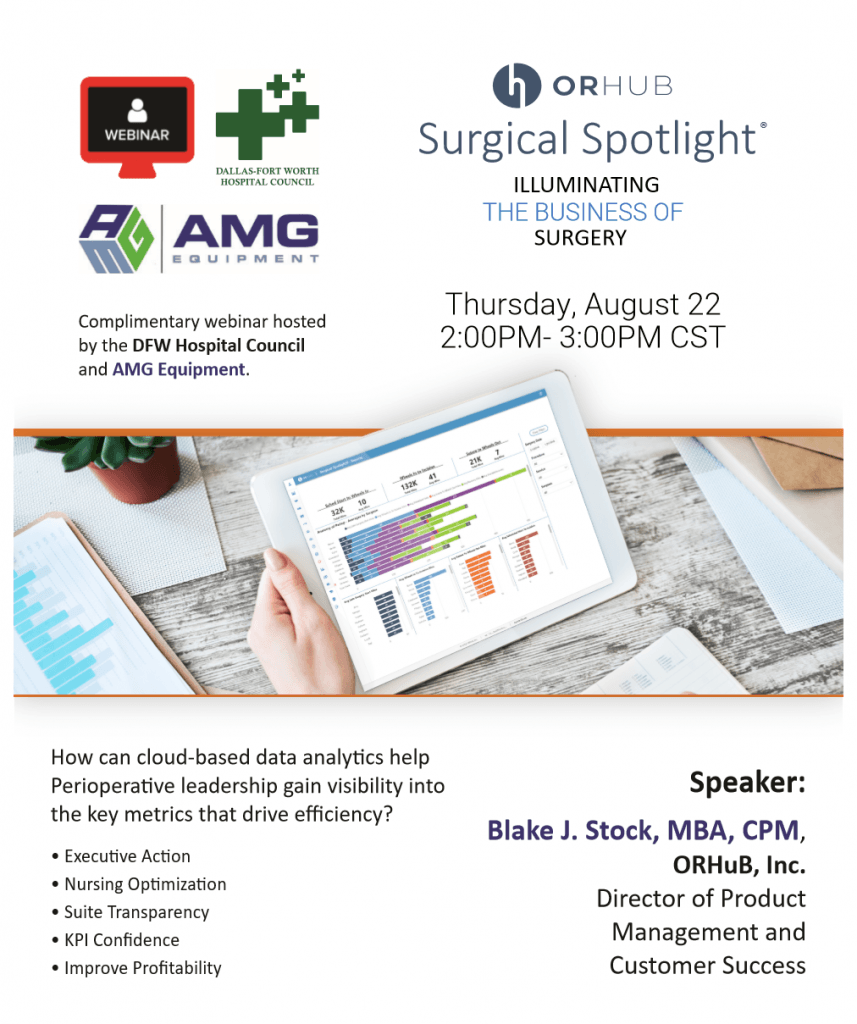
Improving Visibility in the OR through Analytics Webinar!
Our very own Blake J. Stock, MBA, CPM, our Director of Product is presenting with the DFW Hospital Council this week for a webinar on analytics. He will take a group through some industry information giving real-world use-cases on how analytics can improve Block Utilization, On Time Starts, Booking Accuracy, Staffing Models, and materials costs.
Take a look at the flyer here.